


#1 RealTest Backtests
Supercharge Your Trading Now
Reduce drawdown, build diversification, or speed up your development time.

The textbook engulfing breakout, buying when the close clears the previous day's high, lost money on SPY across repeated tests with different start years. Reversing the rules, buying when the close falls below the previous day's low and selling when it rises above the previous high, produced a 0.94 Sharpe, a 0.69 MAR ratio and 15% a year with a 22% maximum drawdown over the last ten years.
Most traders are taught to buy strength. The rule of thumb is simple: when the close is higher than the previous day’s high, that’s a breakout, a bullish confirmation, a sign to go long. But what if this is one of the worst signals in the book? What if the true edge hides in flipping that logic, buying when price closes below the previous low and selling when it breaks above the previous high?
The conventional approach works like this:

It looks good on paper momentum, confirmation, strength. But backtests show the strategy performs poorly over the long run. In multiple tests across SPY data, the account equity curve dropped quickly, and repeated tests starting at different years all ended in losses.
Now flip it:
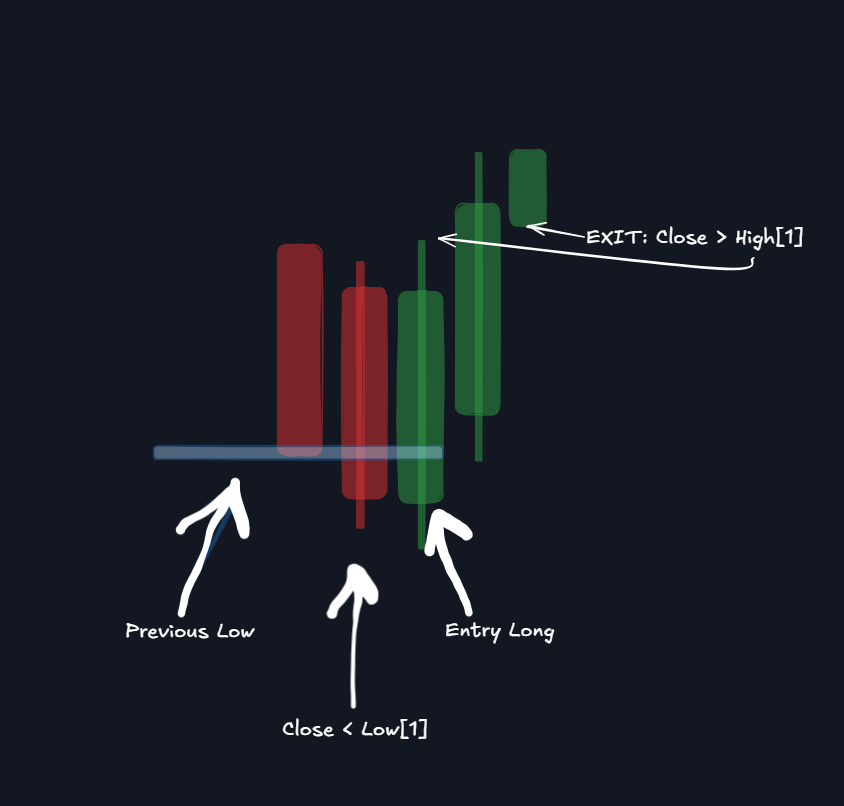
This contrarian entry feels uncomfortable. It means buying weakness, catching falling knives, and waiting through volatility. But discomfort often equals edge.
| Strategy | Sharpe Ratio | MAR Ratio | Annual Return | Max Drawdown |
|---|---|---|---|---|
| Classic Breakout (C > High[1]) | Negative | 0.10 | -5% | Blown up account |
| Reverse Setup (C < Low[1]) | 0.94 | 0.69 | 15% | 22% |
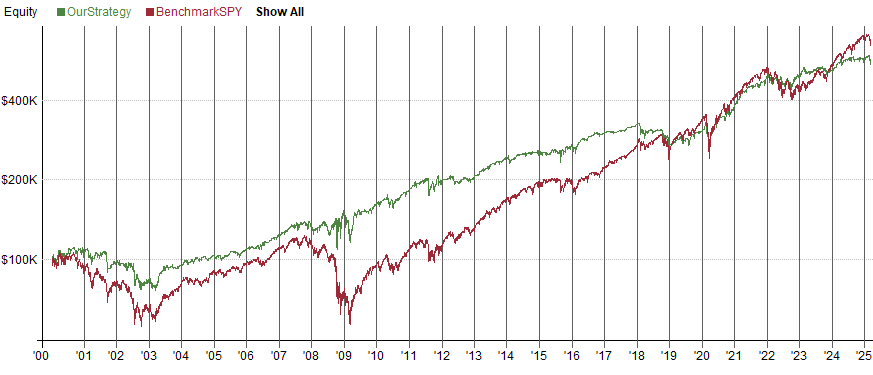
Over the last 10 years, the reverse setup not only outperformed the breakout, it even beat SPY on risk-adjusted returns.
Breakdown
Breakout


When price closes above the previous high, retail traders rush in. Institutions sell into that strength, offloading positions. You’re often the exit liquidity.
A close below the previous low scares weak hands out. Institutions and pros quietly accumulate here, creating mean-reversion pressure upwards.
Buying weakness is hard psychologically. Most traders avoid it, which means the risk premium stays intact. Long-term, that discomfort pays in excess returns.
Here’s a simplified Realtest code snippet to test the reverse engulfing setup on SPY:
Buy = C < Low[1]
Sell = C > High[1]
Want ready-to-use strategy packs? Explore tested Realtest strategies Here.
The “engulfing candle strategy” teaches a bigger lesson: don’t take trading rules at face value. Textbook logic like “buy strength” may look convincing, but in real markets it’s often the worst time to buy. Contrarian approaches, especially when backed by large sample backtests, reveal hidden edges most traders overlook.
Key Takeaway: Buying below the previous low and selling above the previous high has outperformed traditional breakouts in both raw returns and risk-adjusted performance. If you’re willing to hold through discomfort, the edge is yours.
In its textbook form it is a breakout rule: buy when the close is above the previous day's high, treating that as bullish confirmation, and sell when the close falls below the previous day's low. This article tests that rule on SPY and then tests its exact opposite.
Not in this test. Buying closes above the previous day's high produced a negative Sharpe ratio, a 0.10 MAR ratio and around -5% a year, and the equity curve fell quickly. Repeating the test from several different start years produced losses in every case.
The same two rules with the signals swapped: buy when the close is below the previous day's low, and sell when the close is above the previous day's high. It means buying into weakness and selling into strength, which is the opposite of what breakout trading teaches.
A Sharpe ratio of 0.94, a MAR ratio of 0.69, roughly 15% a year and a 22% maximum drawdown over the last ten years on SPY. On risk-adjusted terms that also came out ahead of holding SPY over the same window.
The article's explanation is about who is on each side. A close above the previous high attracts retail buying that institutions can sell into. A close below the previous low frightens weak holders out, and that selling is absorbed. Buying weakness is psychologically hard, so the premium for doing it persists.
The MAR ratio is compound annual return divided by maximum drawdown. It answers how much return each unit of worst-case pain bought. The reverse setup scored 0.69 against 0.10 for the breakout version, which is the sharpest single contrast in the test.
Two lines: Buy = C < Low[1] and Sell = C > High[1]. C is the close, Low[1] and High[1] are the previous bar's low and high. Because there are no lookback lengths or thresholds, there are no parameters to optimise and nothing to curve fit.
It has to be judged against the return that produced it, which is what the 0.69 MAR ratio expresses. The more useful comparison is the alternative: the breakout version reached a far worse outcome, losing the account, so the choice is not between 22% and zero.
That a widely repeated rule is not evidence. Buy strength is standard advice, and reversing it produced better results on this instrument over this period. Any rule taken on trust is worth testing in its inverted form, on a large sample, before it is traded.