Home / Free RealTest Codes / Breakout Flag Pattern Scanner

Skip to product information
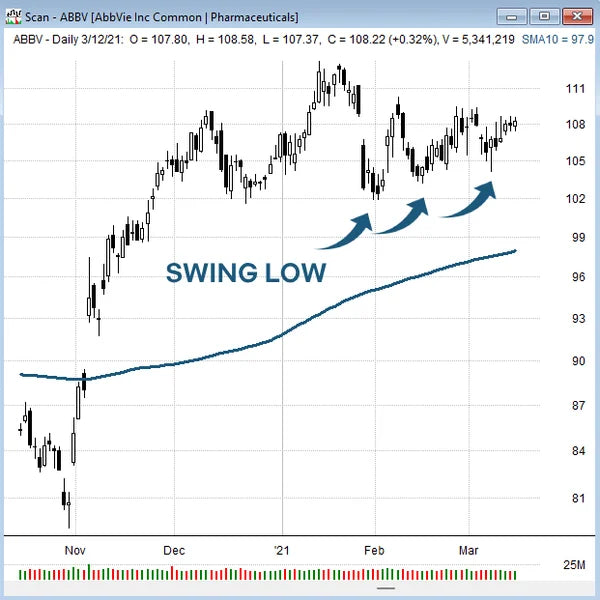
RealTest ABBV candlestick chart with arrows marking rising swing lows above a moving average. mark minervini

Breakout Flag Pattern Scanner

$0.00

This free RealTest scanner identifies tight flag patterns and low-volatility consolidation setups in equity data. The logic is inspired by the approaches of Mark Minervini and Kristjan Qullamaggie, focusing on stocks that have pulled back in an orderly fashion after a strong move. The code can be adapted to different timeframes and watchlists.

Requirements: RealTest

Trading edges

For traders choosing which edge their portfolio is missing.

See all strategies

Candlestick chart of a short term pullback in an uptrend

Daily mean reversion

Buys short-term pullbacks in uptrending stocks. 2-4 day holds.

Candlestick chart of a stock in a strong uptrend

Momentum rotation

Holds the top-ranked liquid Nasdaq stocks and rotates when leaders shift.

Candlestick chart of a dip after a new all time high

All-time high pullbacks

Enters strong dips in stocks that recently broke out to new all-time highs.

Five ETF equity lines rotating in and out of a monthly portfolio realtest

Monthly ETF rotation

Rotates across major liquid asset class ETFs once a month. No daily work.

Multi-strategy portfolios,

or build your own.

Run complete diversified RealTest strategies together, or learn to research and validate your own models.

Multi-strategy portfolios

Run multiple systems together

Claude, the AI used to build strategies in the RealTest course

RealTest AI Course

Build your own with Claude

The full live record is on every strategy page

Three SetupAlpha RealTest strategies and SPY buy and hold, equity from 2000 to 2026
See all strategies