Home / Free RealTest Codes / RealTest Laguerre RSI Code

Skip to product information
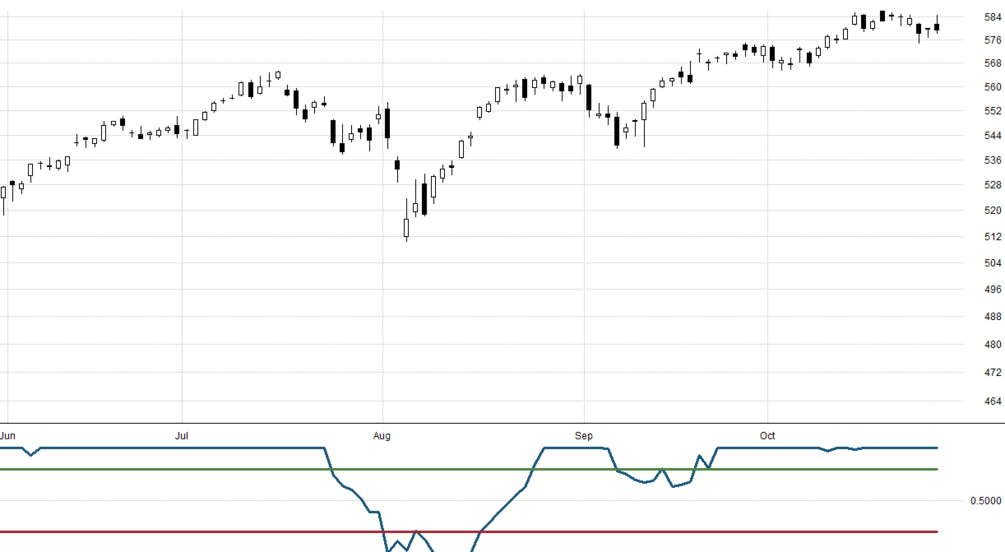
Candlestick chart with Laguerre RSI oscillator and upper and lower threshold lines in RealTest.

RealTest Laguerre RSI Code

$0.00

A RealTest implementation of the Laguerre RSI, originally developed by John Ehlers. The indicator applies a Laguerre filter to price data, producing a smoother oscillator than standard RSI with less lag. This code can be used as a signal generator or as a filter within a larger systematic strategy.

Requirements: RealTest

Trading edges

For traders choosing which edge their portfolio is missing.

See all strategies

Candlestick chart of a short term pullback in an uptrend

Daily mean reversion

Buys short-term pullbacks in uptrending stocks. 2-4 day holds.

Candlestick chart of a stock in a strong uptrend

Momentum rotation

Holds the top-ranked liquid Nasdaq stocks and rotates when leaders shift.

Candlestick chart of a dip after a new all time high

All-time high pullbacks

Enters strong dips in stocks that recently broke out to new all-time highs.

Five ETF equity lines rotating in and out of a monthly portfolio realtest

Monthly ETF rotation

Rotates across major liquid asset class ETFs once a month. No daily work.

Multi-strategy portfolios,

or build your own.

Run complete diversified RealTest strategies together, or learn to research and validate your own models.

Multi-strategy portfolios

Run multiple systems together

Claude, the AI used to build strategies in the RealTest course

RealTest AI Course

Build your own with Claude

The full live record is on every strategy page

Three SetupAlpha RealTest strategies and SPY buy and hold, equity from 2000 to 2026
See all strategies